Smart Room Vignettes
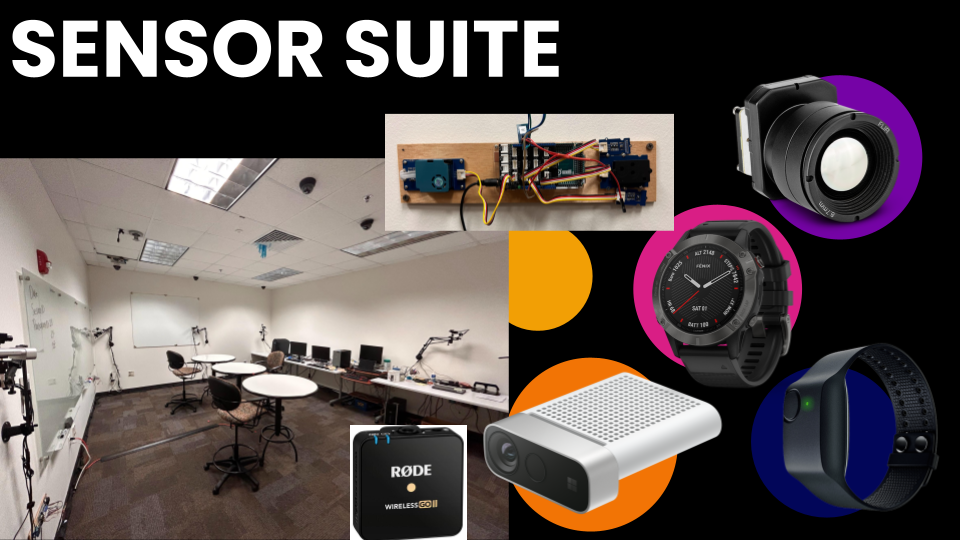
As part of a Minerva Research Initiative grant we developed a situated sensor suite that we called the Smart Room. The sensor suite, as shown below, included FLIR Boson infrared cameras, Azure Kinects, Garmin Fenix 6s, Empatica E4s, Rode Wireless Go IIs, CO2 and air quality sensors.
To display the Smart Room concept and capabilities, we created a few vignettes that could also act as a test dataset to use for method development. This mainly helped demonstrate the video based sensors that inherently capture personally identifiable data. For a look into the non-image based data, check out my blog post about my Smart Room visualization. Here I am mainly going to show off some images captured in the room to illustrate a proof of concept.
With the Kinect, we were able to collect video, depth, and near IR data. From the video data we were able to calculate optical flow which can be seen below on the right.
Since we were capturing streams from 6 cameras at 30 fps on one computer, we had to find creative ways to speed up data capture and writing. Using the built in Kinect capture method, that was compatible with the segmentation and body pose estimation functions, was too slow and too data intensive. To get around this, we saved each stream from each Kinect as individual frames. From there, I had to reconstruct the Kinect Image object in order to extract the body pose estimation. Below you can see a Kinect body skeleton extracted from a deconstructed and then reconstructed stream of someone doing jumping jacks.
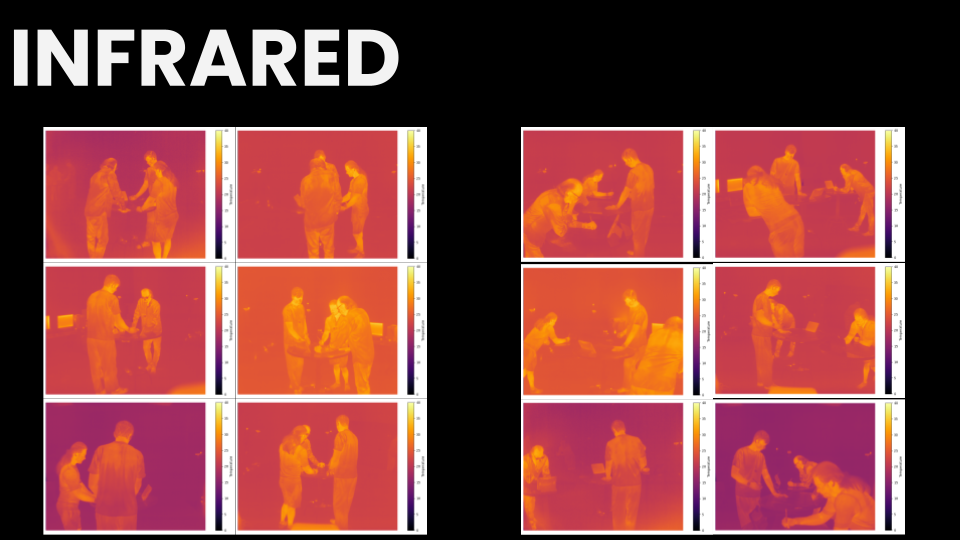
We also collected data from radiometrically calibrated infrared cameras as can be seen above. Our goal was to identify small changes in skin surface temperature. Attempting to solve this problem led to our publication, Reading Between the Colors: Enhancing Feature Perception in Colormaps Through Perceptual Transformations.