Smart Room Sensor Visualization
Unobtrusive Multimodal Sensor Suite in Support of Future Space Missions
A more detailed account of the full study and sensor suite is currently being drafted for publication.
The code for this visualization exploration can be found at emjapo/sensorsational on Github which contains additional insights into the design and development of the experiment and case study.
Background
Humanity has made it to the moon. The next step is Mars. In the mission to Mars there is much more to consider to accomplish this goal due to the increased demands resulting from the increased distance. Before attempting this harrowing journey, it is important to fully study and understand all aspects of the mission from the technicalities of the rocket to the intricacies of the team.
Though most people are only familiar with Neil Armstrong, space missions involve a team of astronauts who work together and engage in complex problem solving to make the mission a success. The team in space also coordinates closely with mission control on Earth making team skills and processes an important aspect for space mission. With long duration space missions these aspects of team dynamics are put to the limits. While short duration missions are able to stay in constant communication with mission control, long duration missions will experience communications delays due to the extreme distance. This creates a need for an automated way to monitor and assist astronauts in mission controls absence.
To reach this goal of automating monitoring and assisting astronauts, we must first gain a better understanding of teams engaging in complex problem solving. For this we use the macrocogition in teams model developed by Fiore et al. (2010) as our theoretical driver to guide our experimental design in the lab environment. The experimental setup includes a sensor suite with unobtrusive sensors around the room to monitor teams in basic cognitive tasks so that way we are able to identify signs of team cognitive processes with the sensors therefore allowing us to apply those findings later to more complex cognitive tasks. Additionally, the sensors work to detect potential environmental factors that may be impacting participants’ cognitive abilities.
For this preliminary study, real groups of three and nominal groups (Hill, 1982) work on four different puzzle tasks. The real groups work collaboratively to complete the tasks whereas the nominal group works independently to some the same puzzle tasks. This analysis focuses on the sensor data collected during the study rather than the results from the puzzle tasks.
Real Groups
In this case study, we will examine two real groups and two nominal groups The real groups of interest are groups from sessions 2 and 10 which represent high social, high aggressive dominance and low social, low aggressive dominance respectively. These groups worked collaboratively to solve four different puzzle tasks.
Nominal Groups
For the nominal groups, we will examine nominal groups from sessions 11 and 12. Both of these sessions had three participants which keeps the number of people in the room consistent between all four groups. This allows us to more accurately compare environmental data between groups. The nominal groups worked on four different puzzle tasks independently.
Sensor Layout
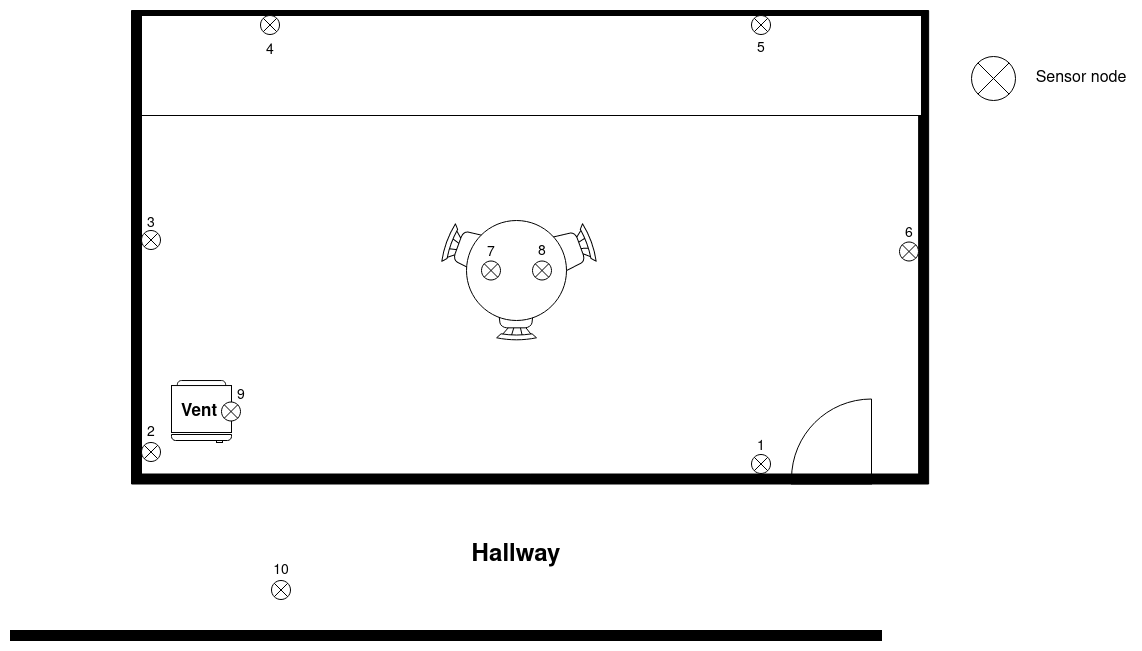
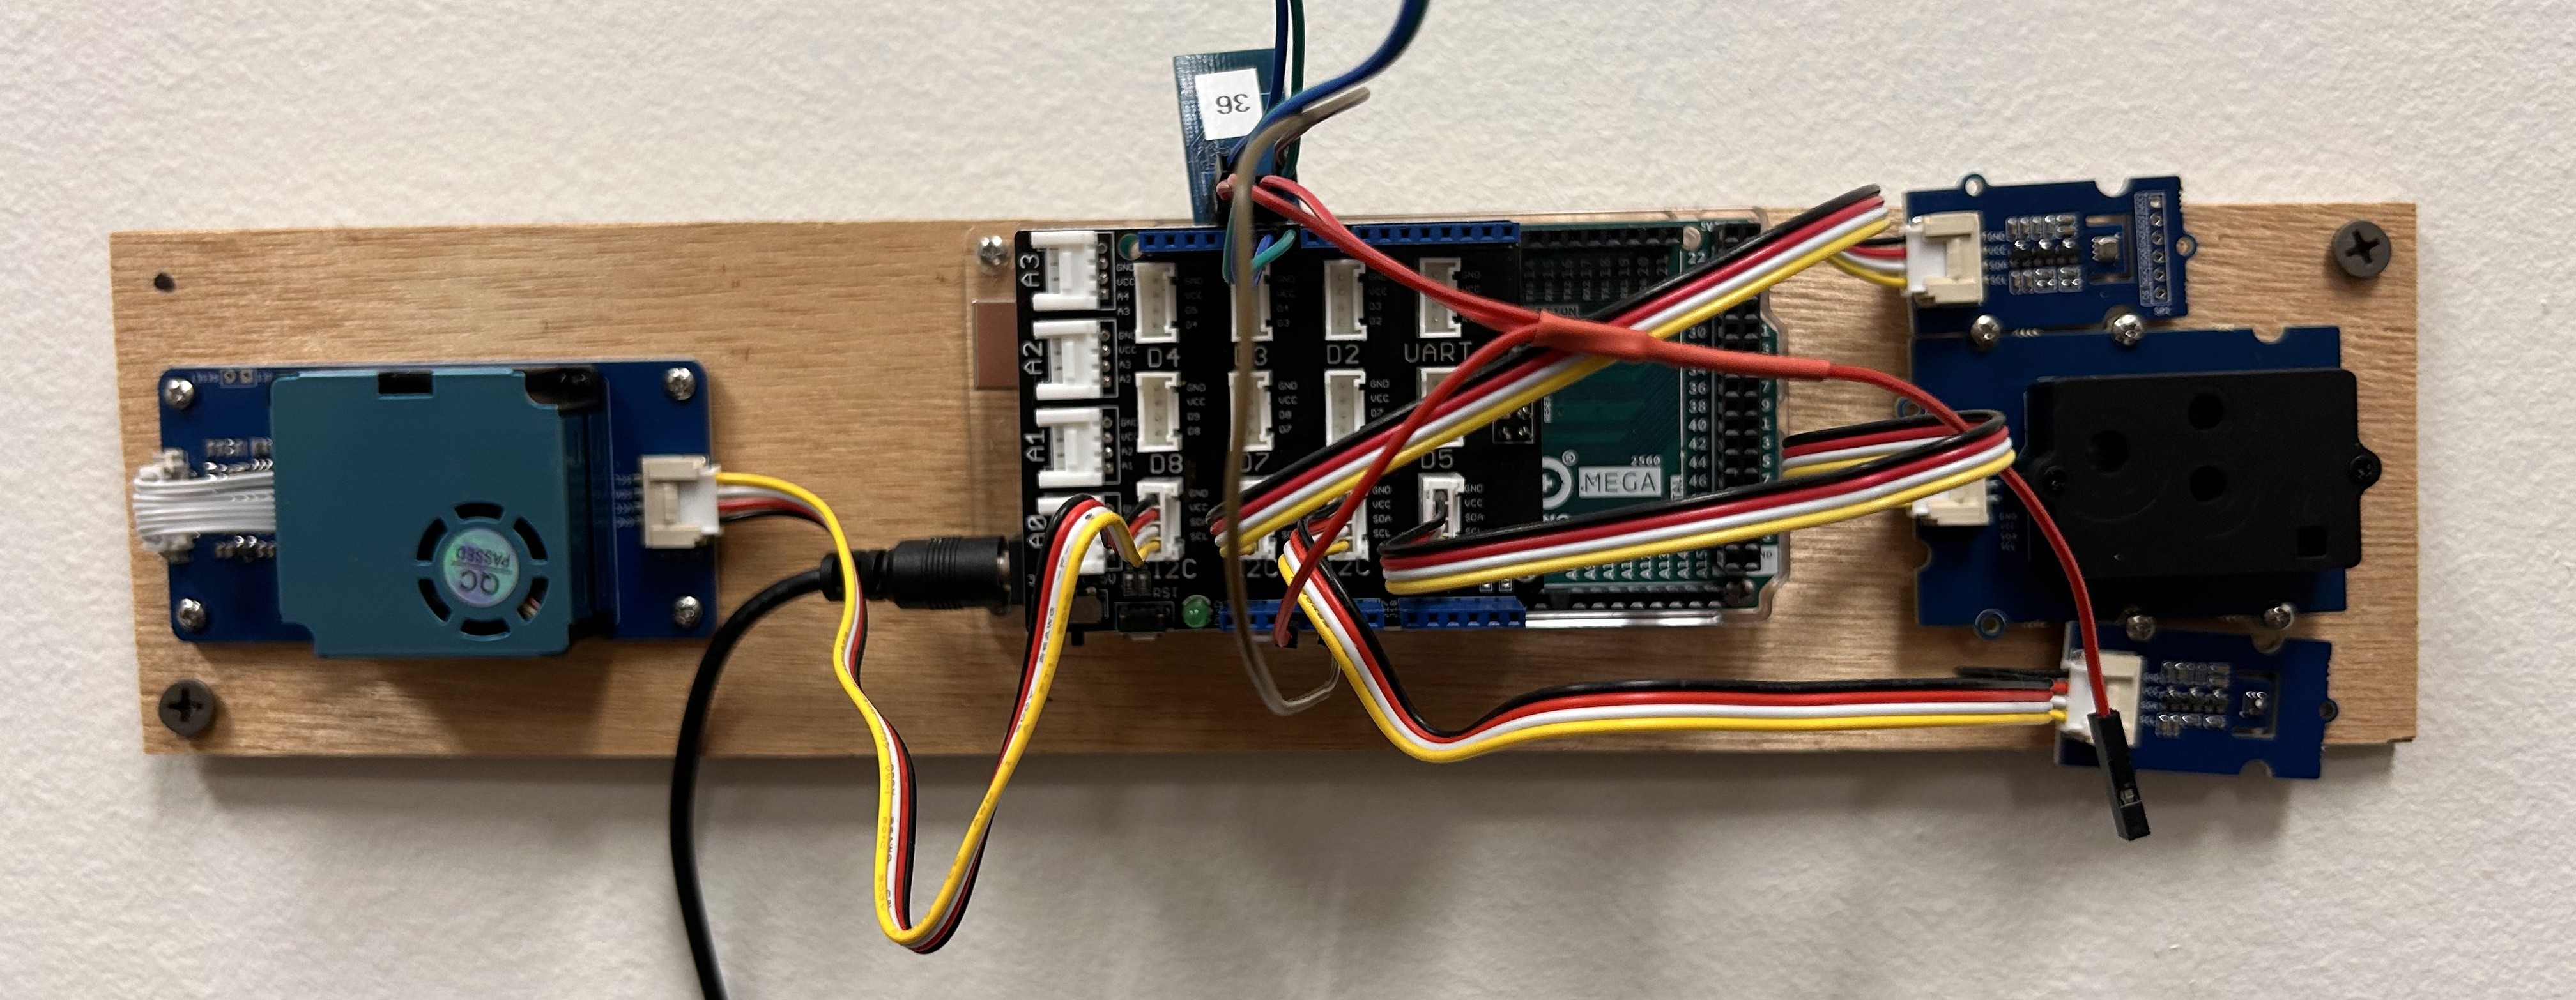
Each of the 10 total sensor nodes placed around the space consist of 4 separate sensors to measure CO2 and air quality. Additionally each participant wore an Empatica E4 watch which measured heart rate and electrodermal activity. These are the main sensors that the following visualizations will focus on.
Design Plan
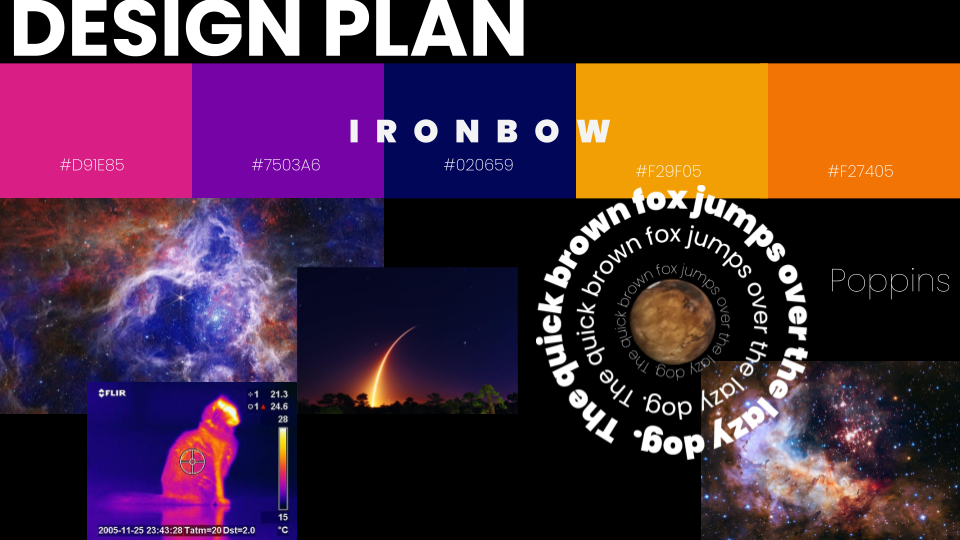
To help visually communicate the space exploration goals of this data, the font and color palette have been carefully selected to subtly communicate the ideas while still prioritizing the data. Taking inspiration from nighttime space launch images and from infrared cameras that were also used in this study, Ironbow was selected as the colormap. Ironbow is a colormap developed by FLIR and popularized for Infrared images. Since infrared is another large part of this project, having a coordinating colormap will increase the visual cohesiveness in the future when the infrared data is added. In the meantime, the colormap invokes the colors of a bright orange rocket trail blending into the dark blues of the night sky. with this color palette choice we are able to communicate the space theme in the present while also preparing for the integration of future data streams.
For the font, the goal was to pick something sleek, futuristic, and round to invoke feelings of the future, progress, and planets. Poppins was chosen since it is a san-serif geometric font that is centered around circular typography. These subtle design design decisions help communicate ideas of the future and space exploration without being distracting from the data.
Overview
The goal of these first plots is to show all of the environmental data that is collected and general trends between real and nominal groups. Since this data describes the environment, the word “session” is used to distinguish between groups. This helps semantically distinguish environmental data from physiological data.
To help distinguish different data types more easily, certain data is color-coded. Purple is used to show gas averages from the sensors inside of the sensor suite room. The baseline measurement comes from sensor 10 which was placed in the hallway. This allows for a comparison between the air quality in the room and outside of the room.
Session 2 is the real group. The grey dashed lines indicate the start and end times of the experimental task.


Session 12 is the nominal group.


Sensors in the experimental room follow similar patterns that differ visibly from the baseline.
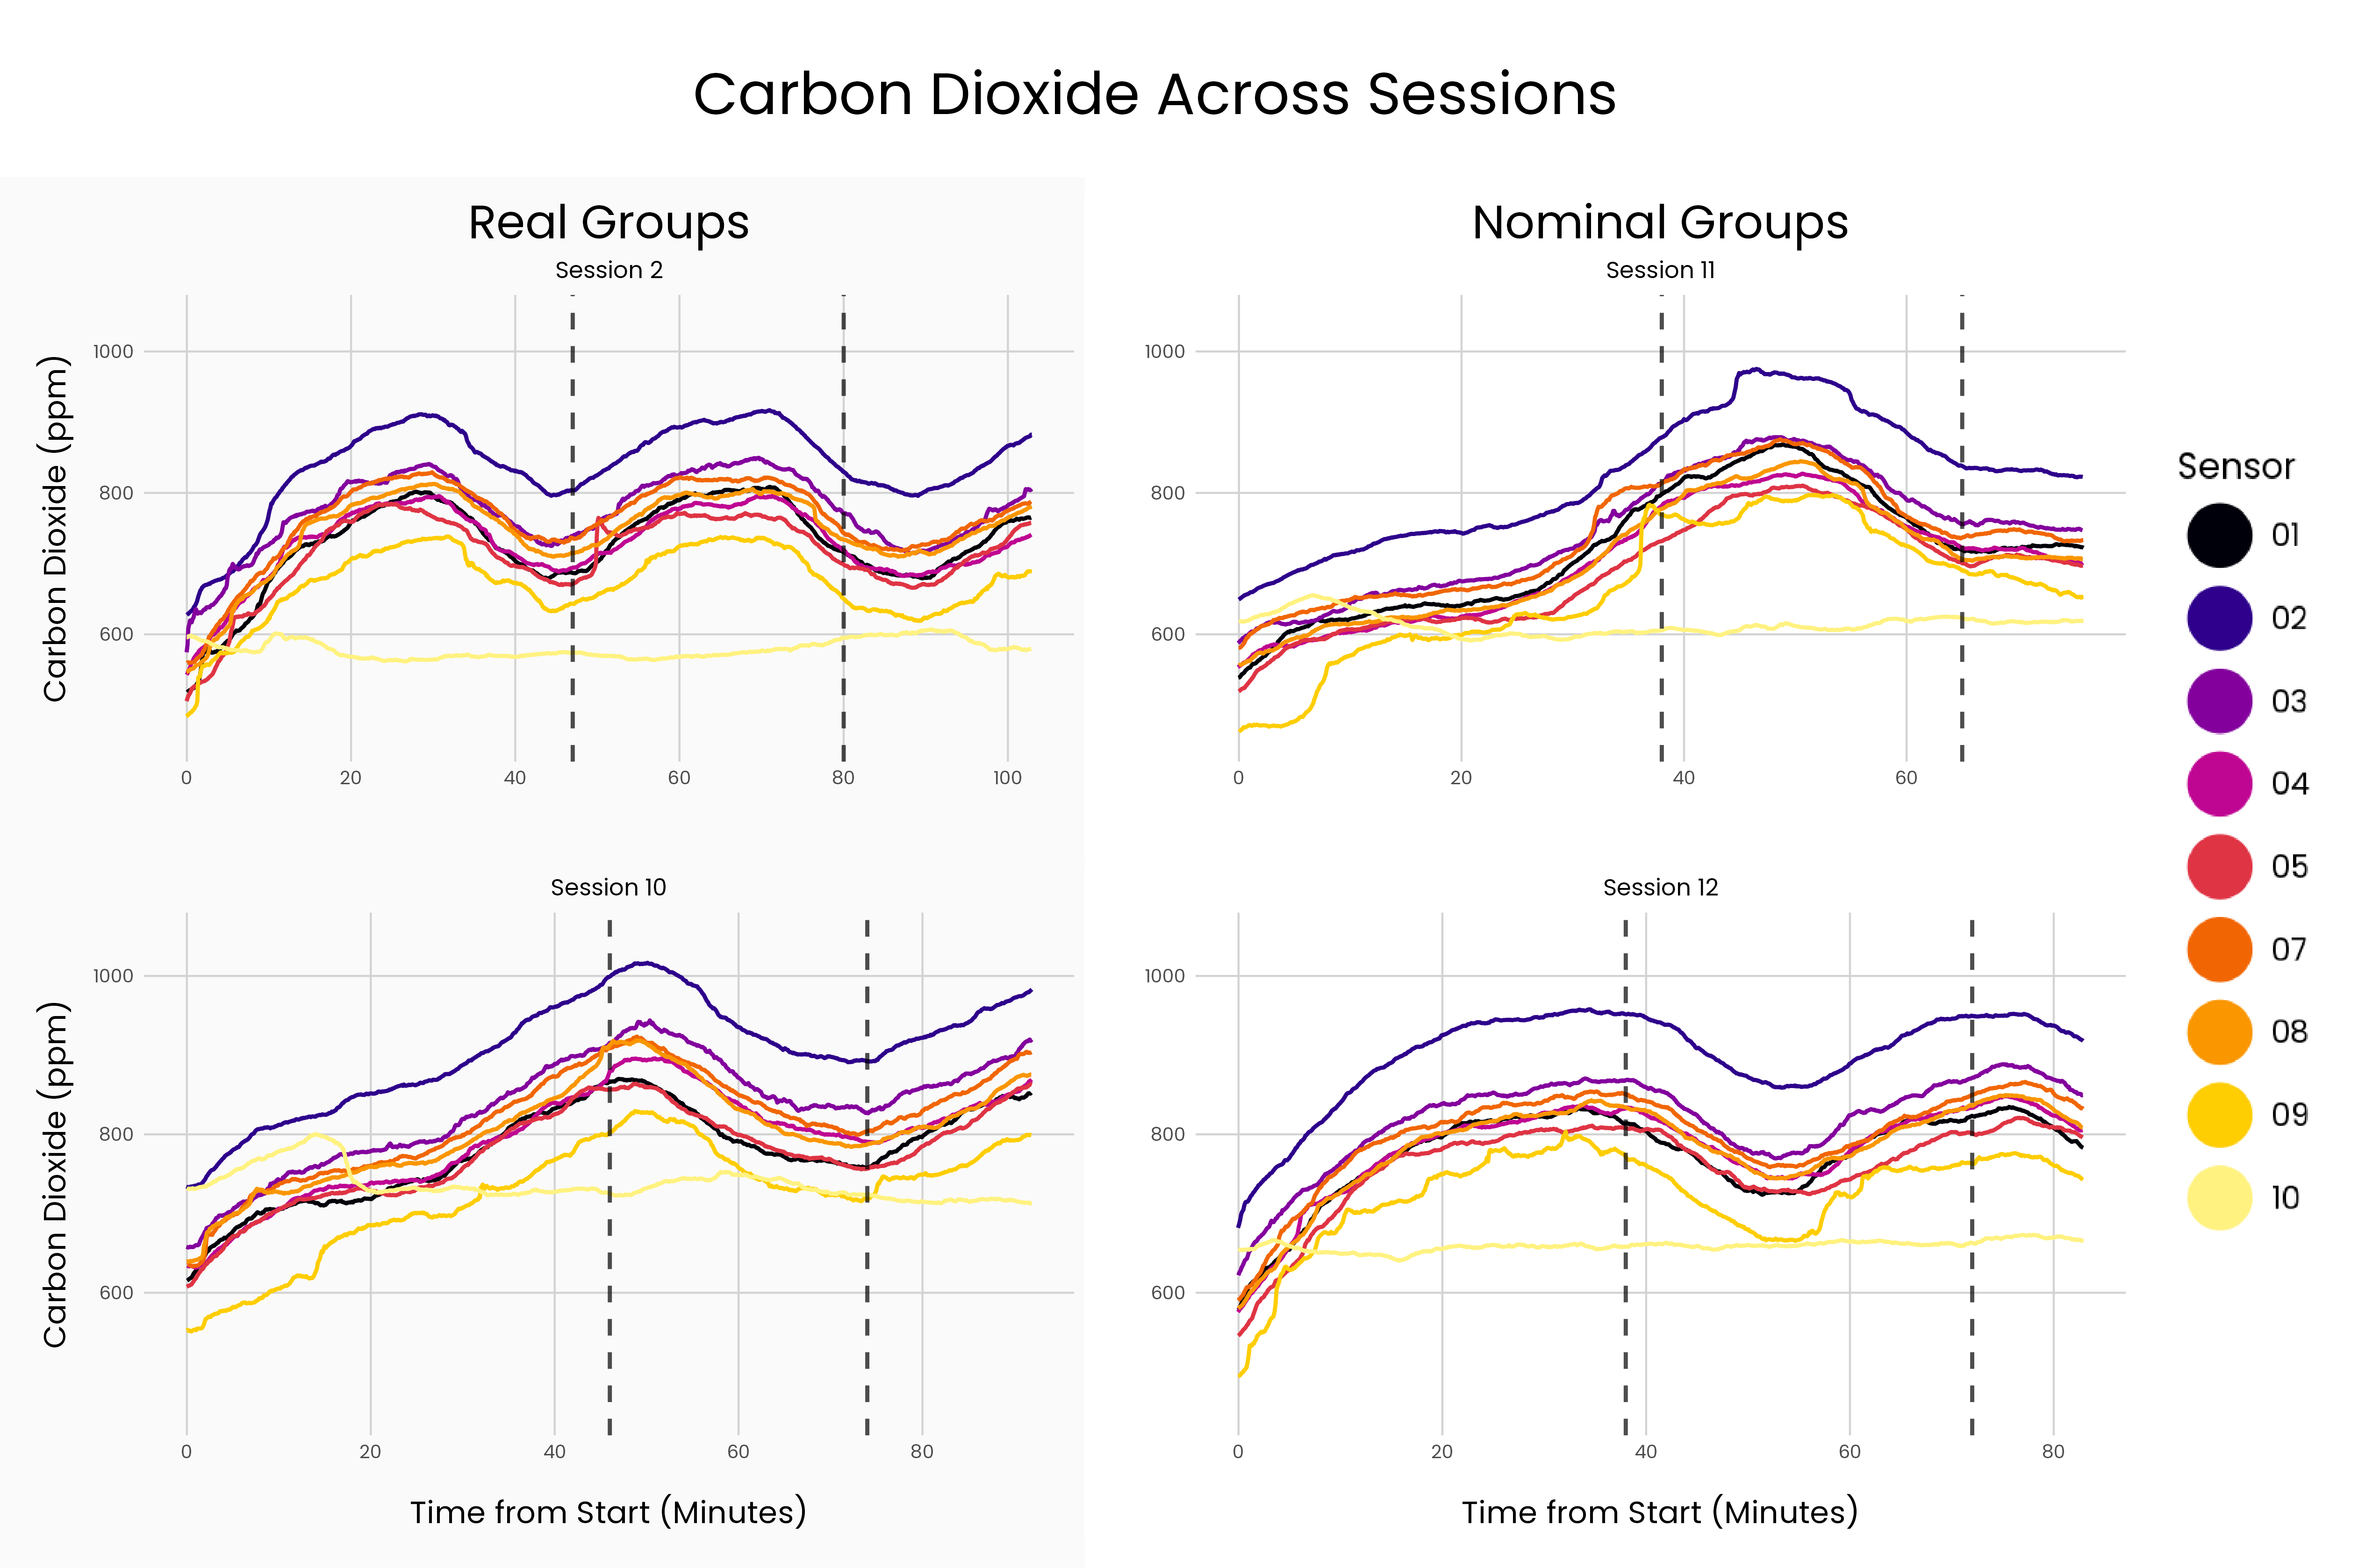
Carbon Dioxide
CO2 is of particular interest to long duration space mission since it impairs cognition when too concentrated in a space (Laurent et al. 2021). While it is understood how CO2 impacts individual cognition, the impacts of CO2 on team cognition have yet to be explored. The goals of these plots are to examine CO2 patterns during the puzzle tasks and look for potential patterns.
The purple line is the average trend line of all of the experimental sensors. There is a potential lag effect as both session end on an increase in CO2.


Both nominal group sessions end on a slight decrease in CO2


However, from just these four sessions there are no obvious patterns to suggest that we can identify a specific behavior.
Empatica E4 - Team Profiles
Electrodermal activity(EDA) and heart rate(HR) can be used to infer arousal states (Kushki et al., 2011). Arousal states indicate the strength of an emotion which is a useful tool for automating team monitoring since it can alert the system to anomalies. However, we are not able to determine valance from these data streams so extreme excitement and extreme anger would be coded the same despite one being conducive to to productivity and one being a detriment. The goals of these plots are to highlight differences between real groups that stem from team profiles derived from individual differences which are determined from questionnaires taken before the experimental task. Team 2 consisted of members with high social dominance/high aggressive dominance, and Team 10 consisted of members with low social dominance/low aggressive dominance (Kalma et al., 1993).
To indicate that the following data channels are measuring physiological data, data is grouped by team rather than session.
EDA
EDA averages are represented using dark orange.
For this there are two types of plots. The first has all 3 members overlayed so that it is easier to compare between members. The second type has each individual trestled to allow for analysis on the individual level.


Heart Rate
HR averages are represented using pink.
For these the focus is on the team average since the individuals do not have as much variation as they did with the EDA data.


By comparing the team averages on the same plot, we are able to see that the high social and aggressive dominance group has a higher heart rate on average.

Conclusion
Definitive conclusions can not be drawn with any confidence from this case study. However, differences in physiological data between profiles shows promising trends. Further analysis and enhancements to the study design could provide more insights into team cognition.
References
This research study is funded by the United States Department of Defense under the Minerva Research Initiative.
Launch photos courtesy of u/dootdoot1997 on r/UCF.
Fiore, S. M., Rosen, M. A., Smith-Jentsch, K. A., Salas, E., Letsky, M., & Warner, N. (2010). Toward an understanding of macrocognition in teams: Predicting processes in complex collaborative contexts. Human Factors, 52(2), 203-224.
Hill, G. W. (1982). Group versus individual performance: Are N + 1 heads better than one? Psychological Bulletin, 91(3), 517–539. https://doi.org/10.1037/0033-2909.91.3.517
Kalma, A. P., Visser, L., & Peeters, A. (1993). Sociable and aggressive dominance: Personality differences in leadership style?. The Leadership Quarterly, 4(1), 45-64.
Kushki, A., Fairley, J., Merja, S., King, G., & Chau, T. (2011). Comparison of blood volume pulse and skin conductance responses to mental and affective stimuli at different anatomical sites. Physiological measurement, 32(10), 1529–1539. https://doi.org/10.1088/0967-3334/32/10/002
Laurent, Jose Guillermo Cedeño, Piers MacNaughton, Emily Jones, Anna S. Young, Maya Bliss, Skye Flanigan, Jose Vallarino, et al. 2021. “Associations between Acute Exposures to PM2.5 and Carbon Dioxide Indoors and Cognitive Function in Office Workers: A Multicountry Longitudinal Prospective Observational Study.” Environmental Research Letters 16(9): 094047. doi:10.1088/1748-9326/ac1bd8.